Want In-Depth PPC Training?
Visit the ParaCore AcademyTimestamps:
[0:48] – Reporting
[1:07] – Tags
[1:38] – Setting up Tags
[2:50] – Call Attribution
[4:50] – Form Attribution
[5:56] – Lead Funnel
Transcript:
By now you’re receiving data about your calls and potential leads, but how do you report on the data received? If you just want raw data AdWords has that. CallRail has raw data, as well, including additional information and metrics to help you analyze your information.
I’m Adam Arkfeld, owner of ParaCore, a lead generation company for PPC advertising. This is the 7th video of 10 in my Ultimate Guide to Using CallRail for your PPC Marketing. It’s a comprehensive video series for using CallRail, a third-party call tracking system, with your pay-per-click marketing. Once you’re done with the series, you’ll be a call tracking AND CallRail guru. If ever you want to jump to a specific section of the video, we’ve included timestamps in the description below. You can always watch previous videos as a refresher or skip ahead to other videos if I’m covering a topic you’re familiar with.
In this video, we’ll be covering Call Attribution, Form Attribution, Calls by Landing Page, and Lead Funnel reporting. There are other report options on the Reporting page of CallRail, but we’ll be focusing on these four because they’re used the most. Before we get started I want to cover how you can use tagging to report on qualified leads versus just calls. This is an alternative way of reporting that is done under the Activity Dashboard. Using tagging to report allows you to get more accurate data information because you’re using campaign tags. Basically, you’re filtering your calls by their tags, so you can distinguish between qualified leads, duplicate calls, or irrelevant calls. You’re filtering OUT the calls that don’t serve you. For example, when someone might be calling about a job as opposed to being an actual lead.
To generate a report this way you’ll need to make sure that you’ve set-up campaign tags for your Google AdWords. We covered that topic thoroughly in Video Six if you need to go back and set-up your tags. If not, then will continue with how you generate reports using tagging. From the Activity Dashboard page, you’ll notice you’re automatically viewing the Call Log page, which is exactly where you need to be for this report. This is what you’ll see when you’re on that screen (Figure 7.1 below).
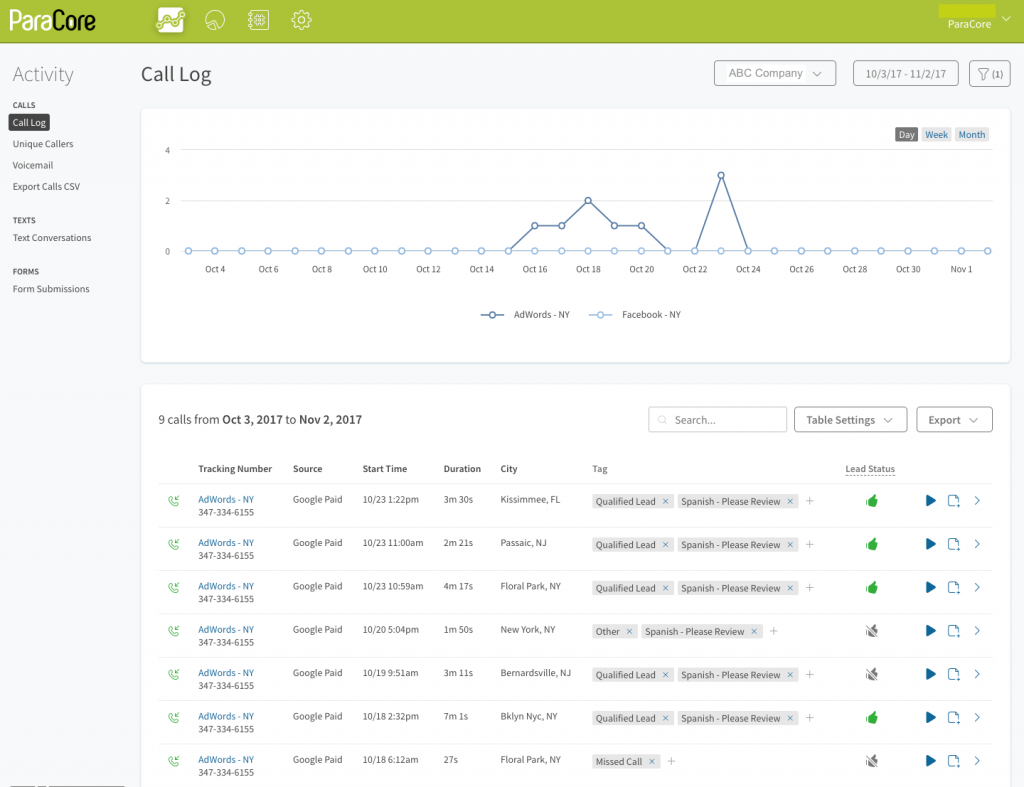 Figure 7.1: This is how the Dashboard Call Log report looks.
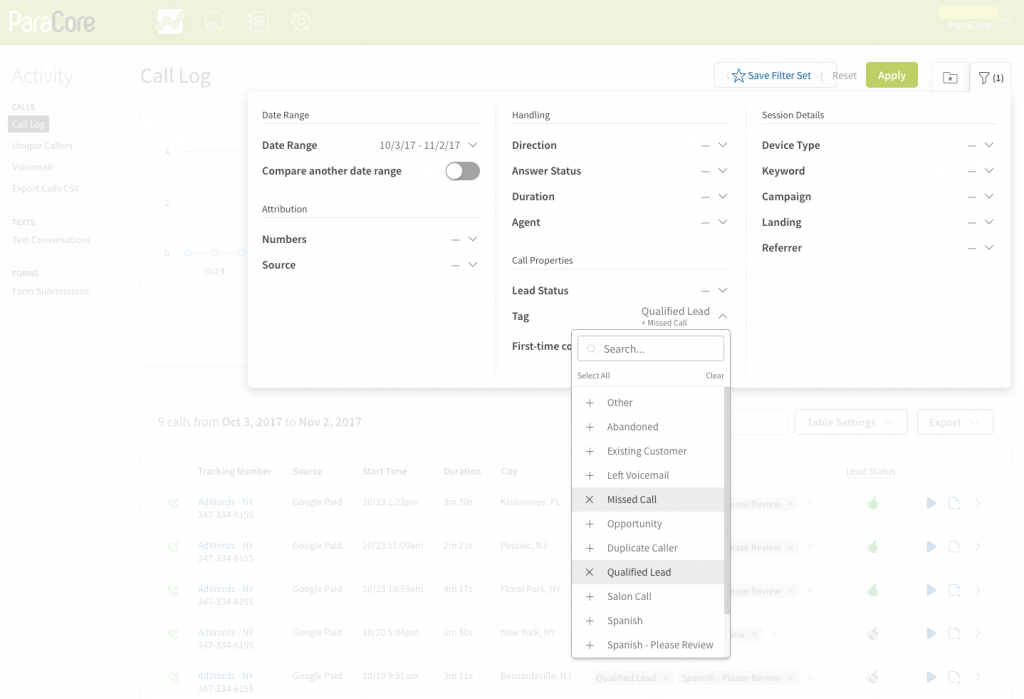
You’ll notice that nothing is filtered yet, so all calls, relevant and irrelevant are showing. What you need to do now is apply filters, so you only see the call report that you want to view. First you click on the All Filters icon in the upper right-hand corner (Figure 7.2 below).
The second step is to choose your date range of calls. Then, choose the tags you want to filter by; for example, Missed Call and Qualified Lead. Although you have numerous other options in the All Filters screen you’ll want to stick to tags, or lead status for this report. So: after you’ve chosen your tags, the final step is to click on the green Apply button to update the view of the page. This is what it looks like after you’ve applied those tag filters (Figure 7.3 below).
 Figure 7.3: Example of Call Log after you apply the filters.
Now you can focus on the important calls and export your report into a file, or print it. To do either, click on the Export button at the top of the report log, under the graph (Figure 7.4 below).
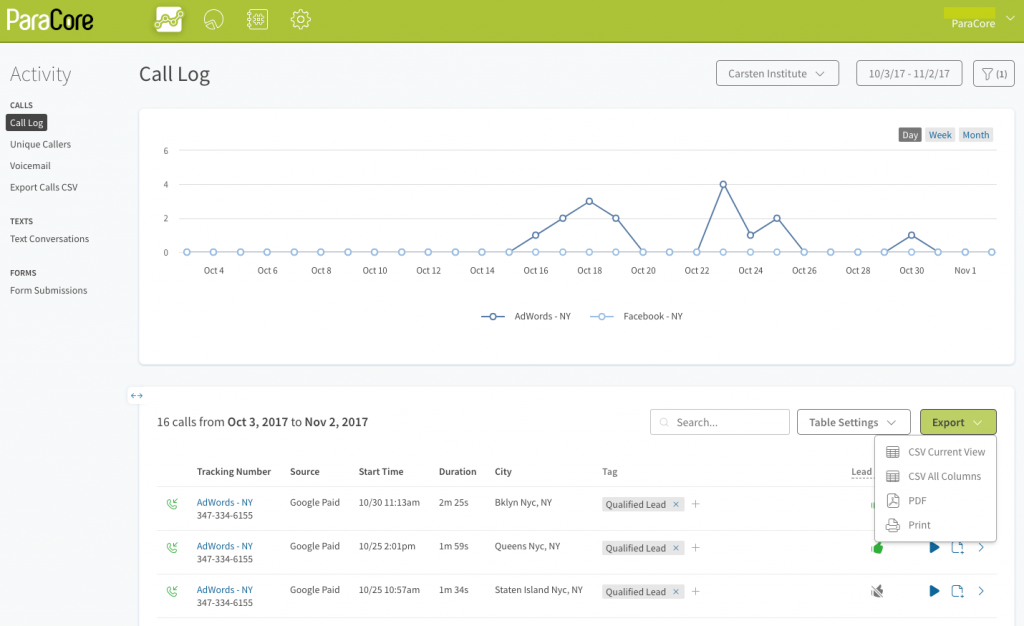 Figure 7.4: Click the “Export” button and choose how you’d like to save it.
From there you can save the report as a CSV file or print it. This report is as simple as it gets and it’s extremely useful. So now let’s switch gears and talk about the four most commonly used reports, starting with Call Attribution.
The Call Attribution report provides insight into the sources and interactions that are generating calls. Accessing and generating the Call Attribution report is the same as using tagging reports only the data generated is different. All four reports that we cover in this video are filtered and generated the same way. We’ll go a little more in-depth on this report, so you’ll have a solid understanding of the overall process. Then, I’ll touch on the three reports.
First off, if you have more than one company you track calls for, you’ll want to choose the company whose Call Attribution report you’d like to view. Next, you’ll click the Reports icon at the top of the page. THEN, select Call Attribution within the Acquisition list (Figure 7.5 below).
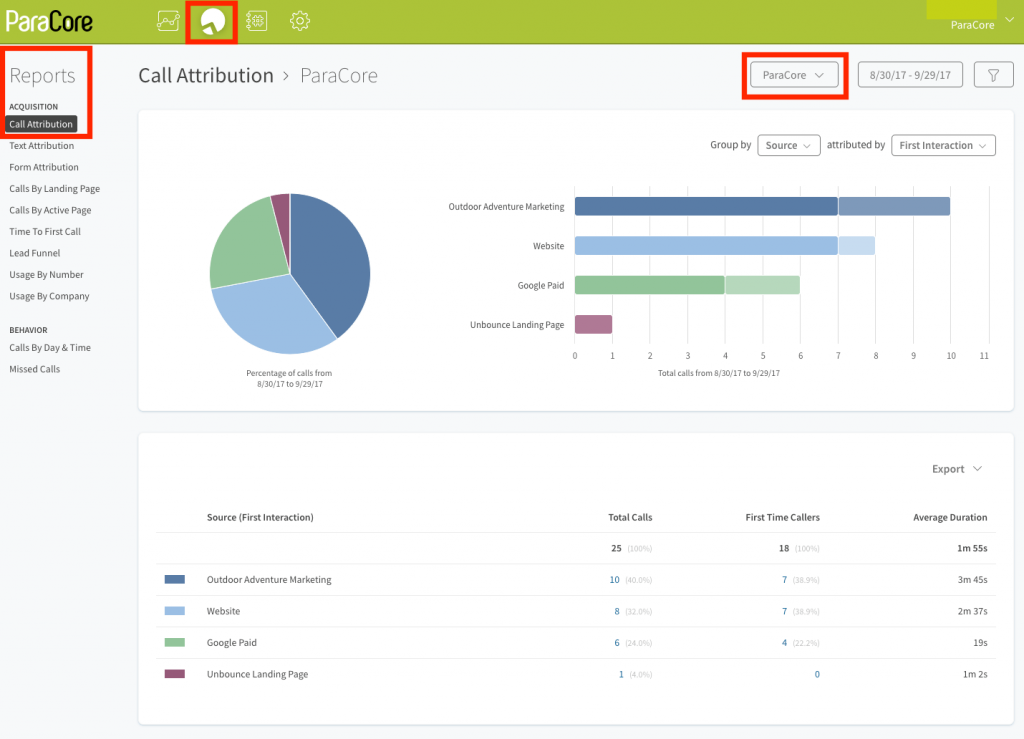 Figure 7.5: This is an example of the Call Attribution report from the dashboard page.
You’ll notice the other reports we’ll be covering in this video are on that list, as well. From here you can view and interact with your Call Attribution report. CallRail will display the results of your default report settings automatically. The columns below the pie chart illustrate which sources and campaigns are bringing calls in to your business. The Source column shows the name of your campaign as it’s configured within your account. The Total Calls column shows the total number of calls received by this source. The First Time Callers column provides how many of the total calls are first-time callers. And the Average Duration column provides the average amount of time spent on the phone with callers who call from this campaign.
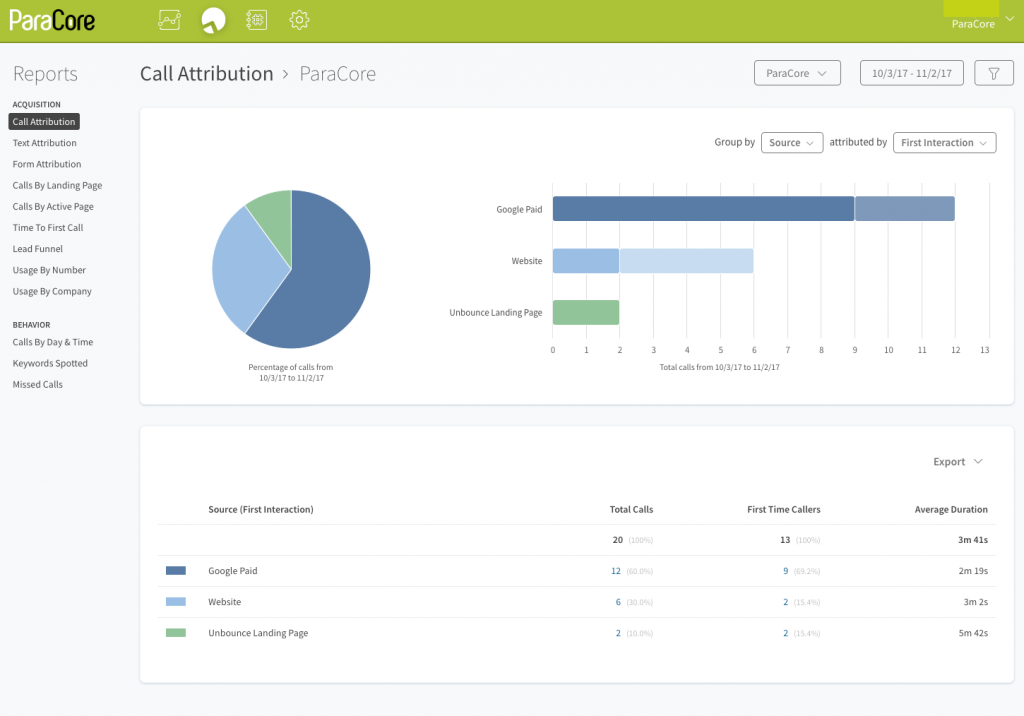 Figure 7.6: Click on the hyperlinked number to see that report breakdown.
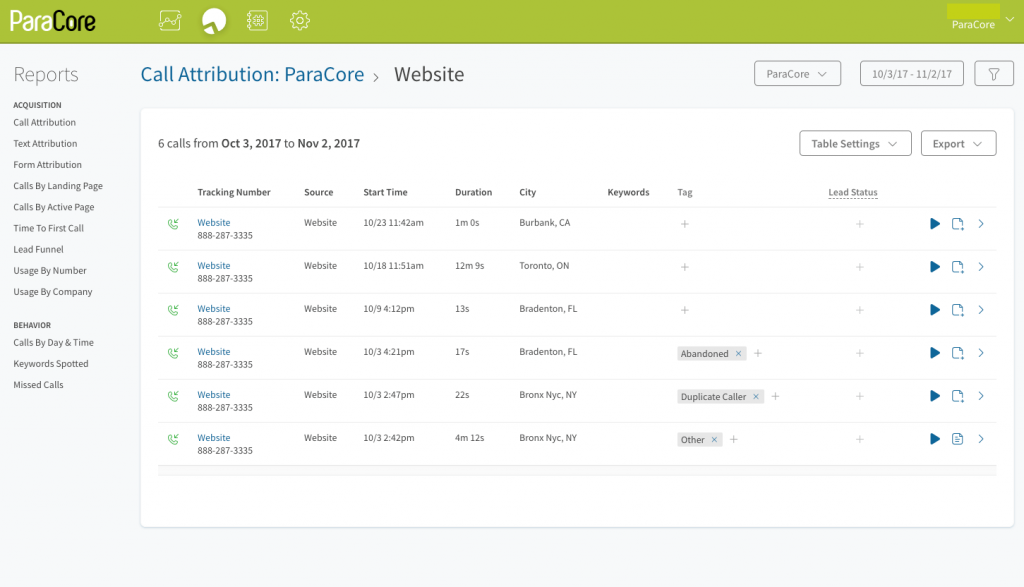 Figure 7.7: This is what the report breakdown looks like after clicking on the hyperlinked number.
You also have the option of selecting the links in the Total Calls or First Time Callers column to view a call log of all calls that fall into either category (Figure 7.6 and 7.7 above). These links are available for any company’s Call Attribution report.
Also: you can group your reporting data by source and interaction from this screen to see a granular breakdown of the types of calls you receive. Select the Source drop-down at the top of the page to see specific campaign information in your Call Attribution report (Figure 7.8 below). Your choices are Source, Keywords, Campaign, Referring Page, and Landing Page.
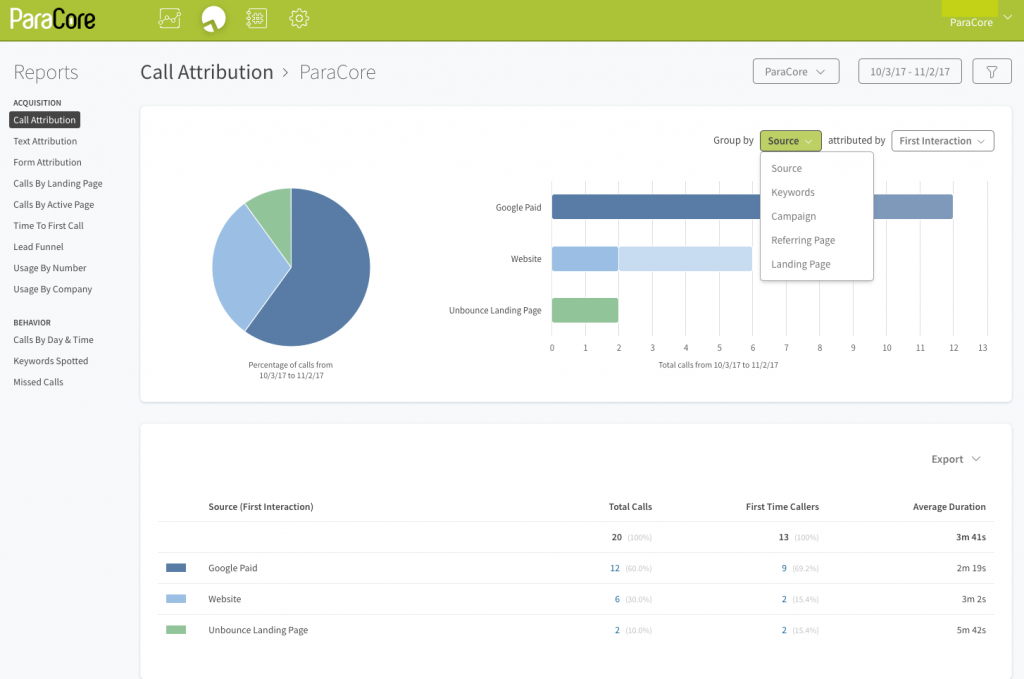 Figure 7.8: Group your data by source.
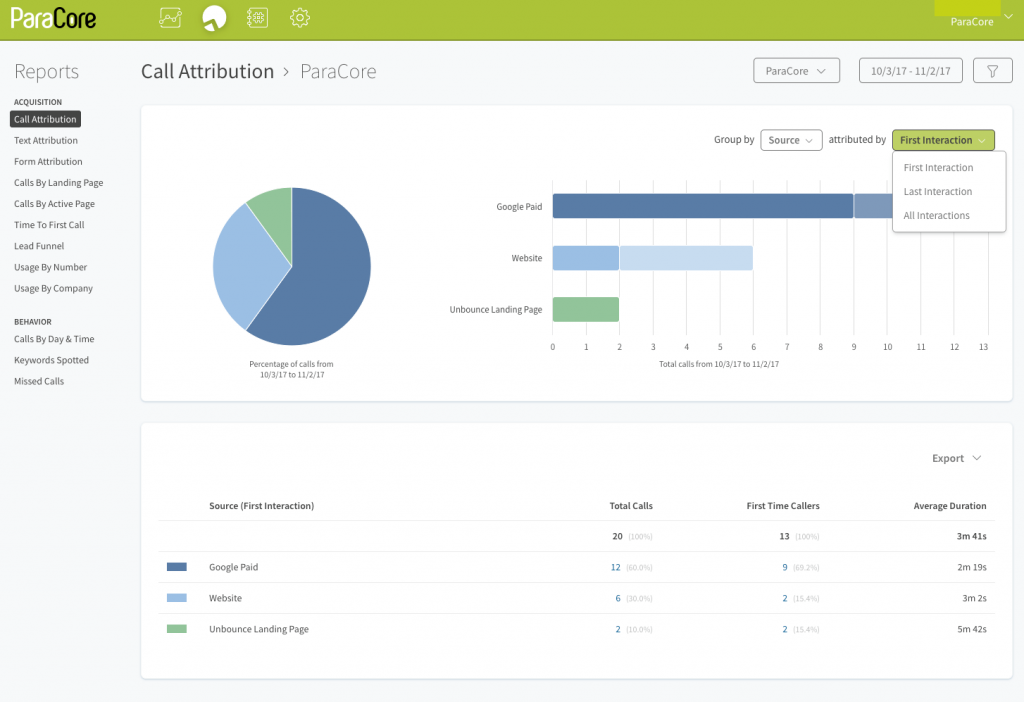 Figure 7.9: Group your data by interaction.
Then, choose the Interactions drop-down to view a specific interaction for the source you selected (Figure 7.9 above). Your choices of interactions are First Interaction, Last Interaction, All Interactions. Select First Interaction to see first-time visitors to your website. Select Last Interaction to see last visited by your website visitors. And select All Interactions to see an overview of your website traffic. The graph will update according to the source and interaction you choose. You can also hover over the pie chart to see a breakdown of repeat callers versus first-time callers (Figure 7.10 below).
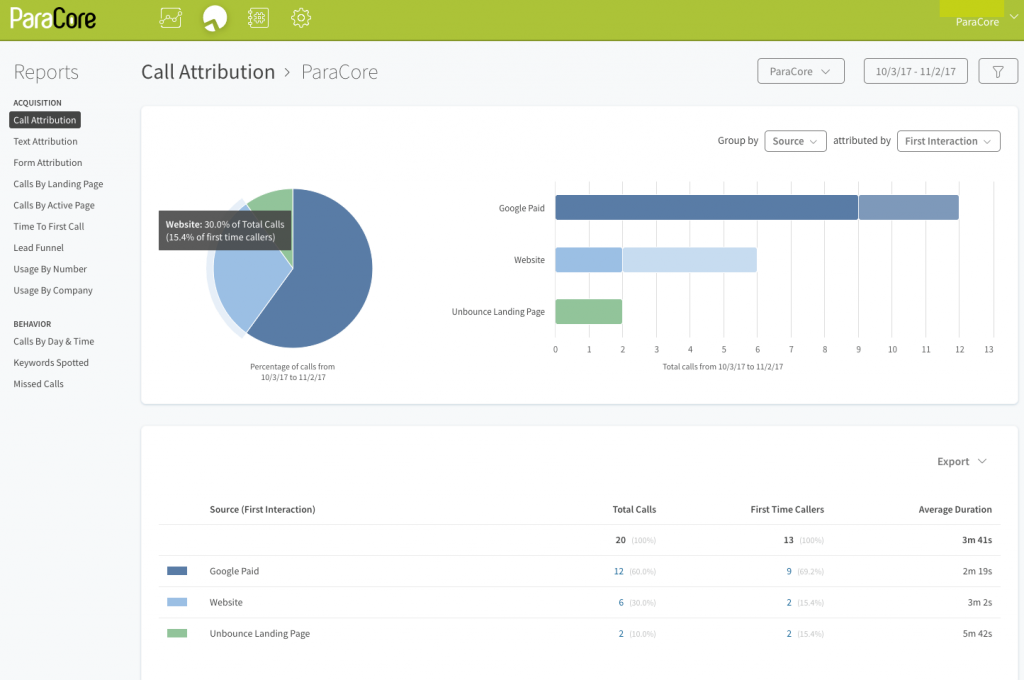 Figure 7.10: Hover over pie chart for a breakdown of data.
Now let’s talk about filters. Just like you did with the Tagging Report in the Call log, you can apply filters to your reporting data. For this report, you’ll apply filters to find callers that fit specific criteria. Click on the All Filters funnel icon from the top right-hand corner of the page. Select your filters to sort your data (Figure 7.11 below).
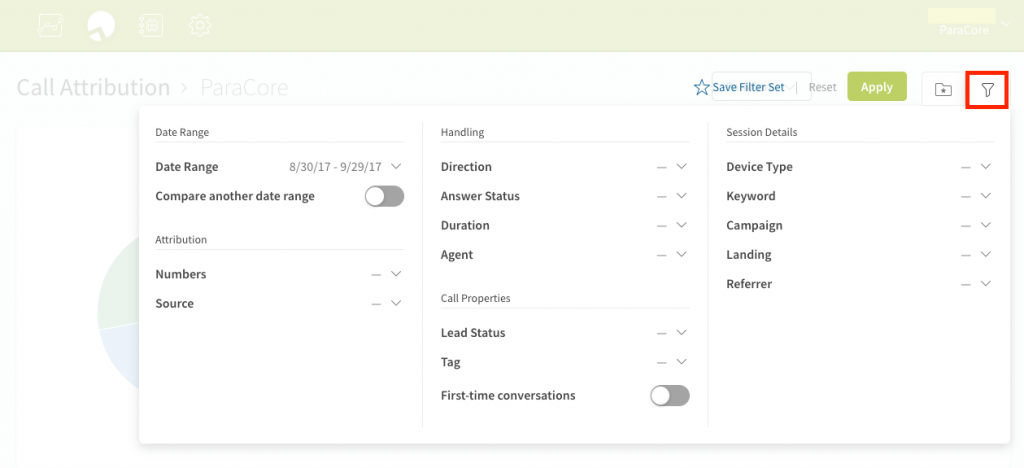 Figure 7.11: This is what the screen looks like when you’re applying filters.
You can filter by Date Range to see calls within a specific set of dates. Select the checkbox for Compare Another Date Range to compare the performance of your data with another date range (Figure 7.12 below).
 Figure 7.12: Filter by Date Range.
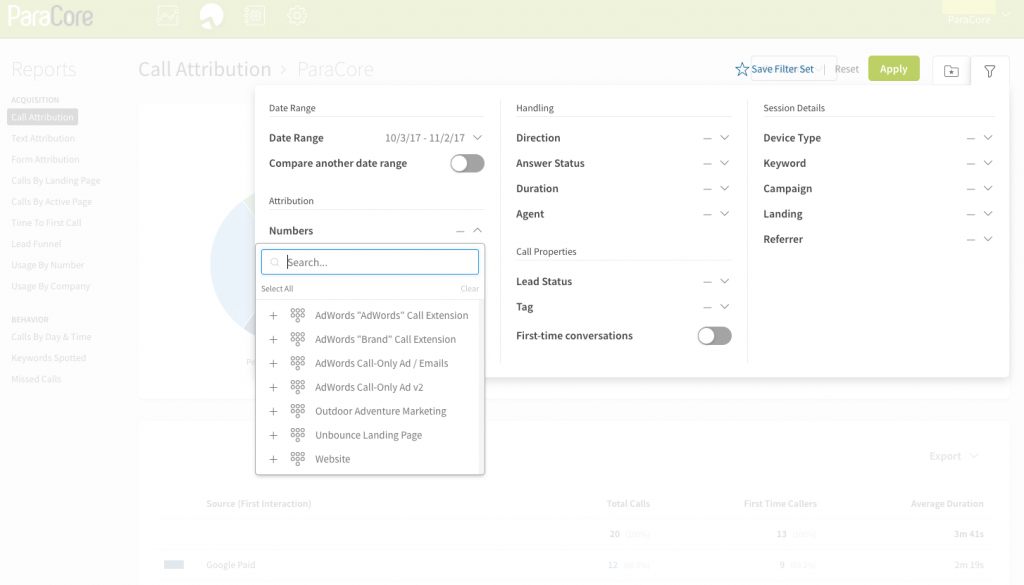 Figure 7.13: Filter by Numbers, for example, “Website” phone number.
Filter by Number to see calls placed or received by a specific tracking number (Figure 7.13 above).
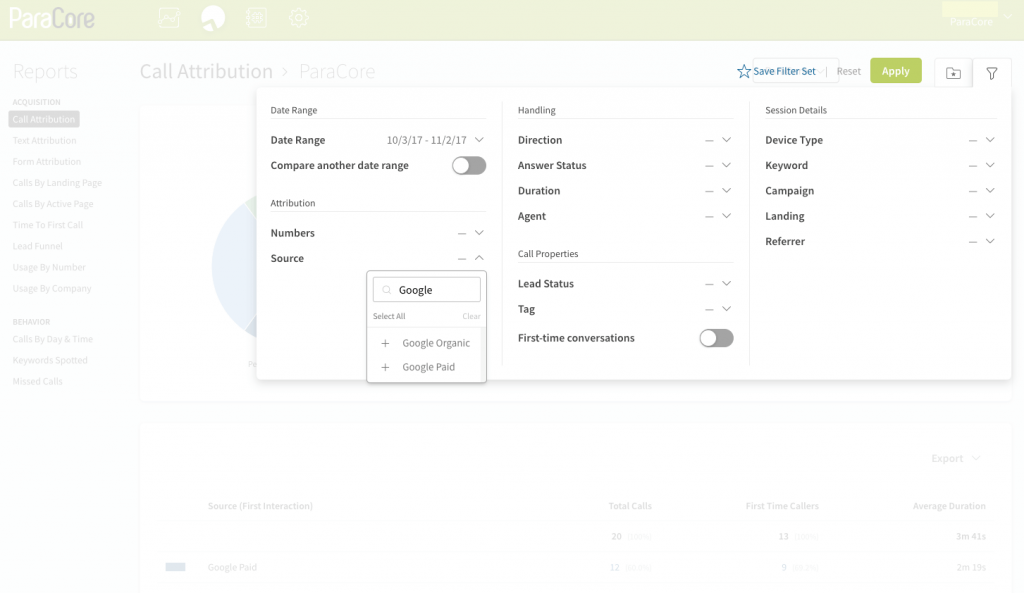 Figure 7.14: Filter by Source.
Filter by Source to find calls with specific referring data (Figure 7.14 above). Type in the source you’d like to see to find calls in this filter set; for example, Google Paid.
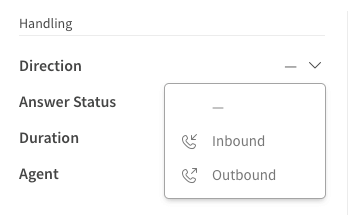 Figure 7.15: Filter by phone call Direction.
Filter by Direction to see inbound or outbound calls (Figure 7.15 above).
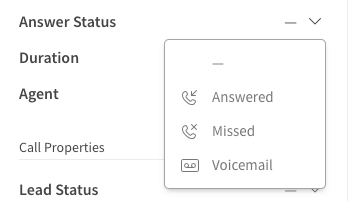 Figure 7.16: Filter by Answer Status.
Filter by Answer Status to find calls that were answered, missed, or reached a voicemail (Figure 7.16 above).
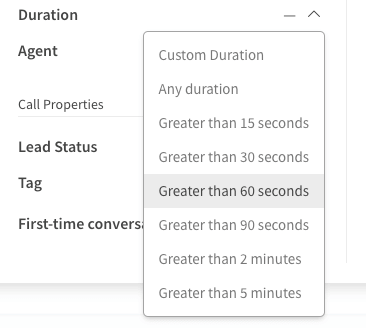 Figure 7.17: Filter by Duration.
Filter by Duration to see calls that lasted longer than a certain number of minutes or seconds (Figure 7.17 above).
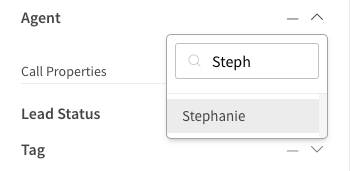
Filter by Agent to see calls placed and received by a specific Agent (Figure 7.18 above).
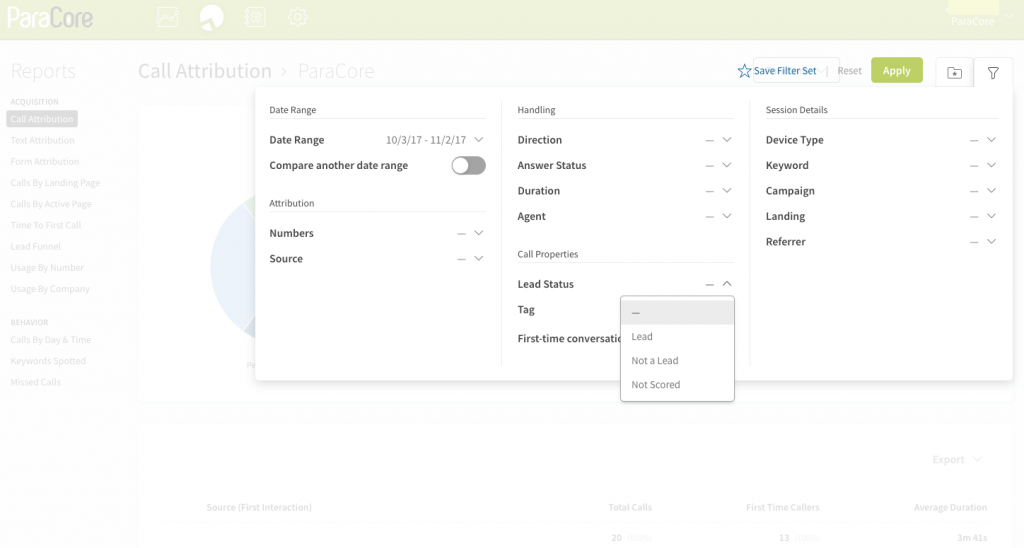 Figure 7.19: Filter by Lead Status.
Filter by Lead Status to see calls that were marked as leads (Figure 7.19 above).
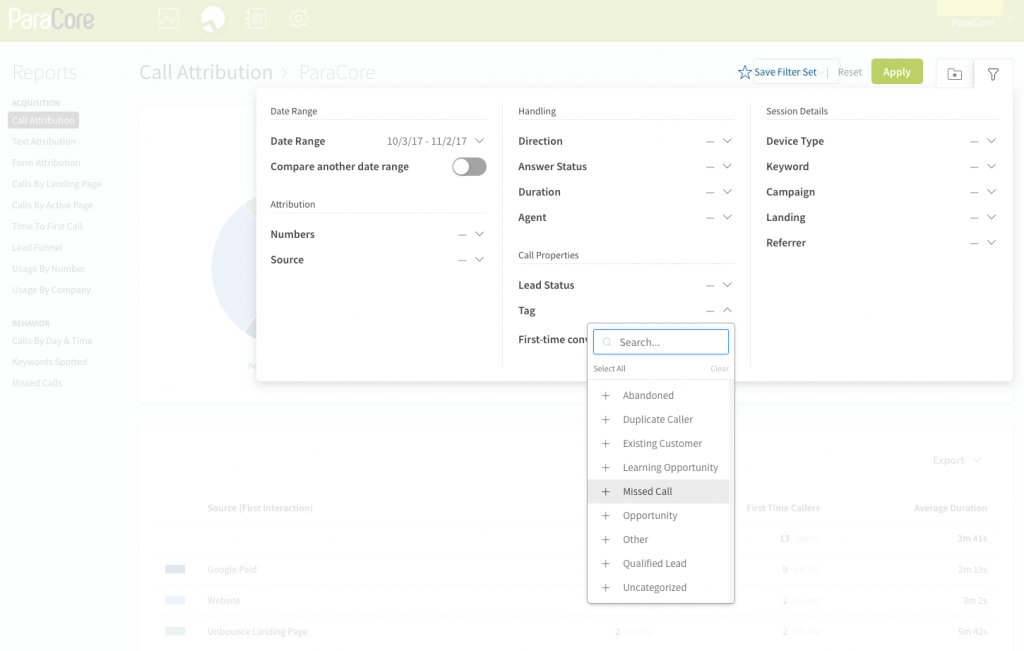
Filter by Tag to see calls that have been assigned a specific call tag (Figure 7.20 above). You can choose as many of these as you want, or all of them if you want an overall look at all of the calls.
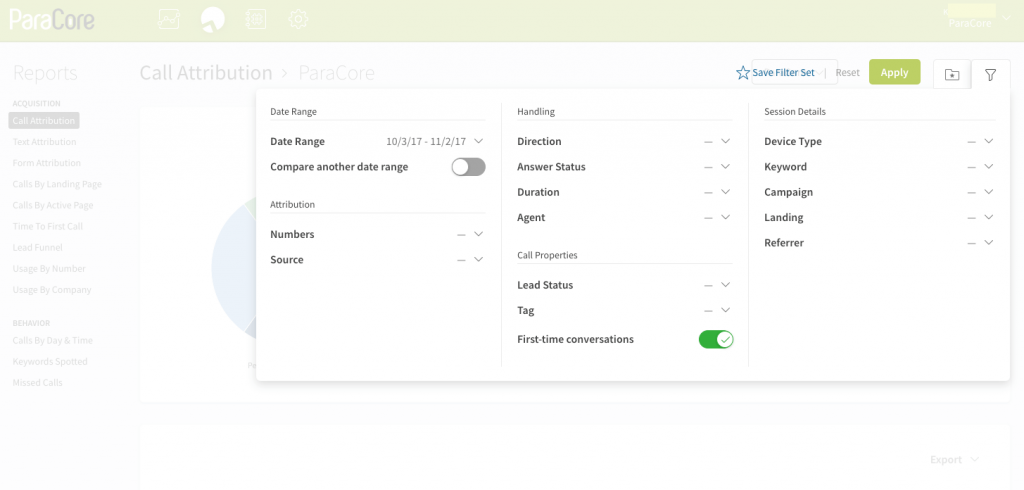 Figure 7.21: Filter by First-time conversations.
You can select the checkbox for First-time conversations to find calls that not only meet your filter criteria but also came from new callers based on the telephone number your customer called from (Figure 7.21 above).
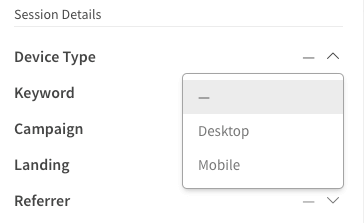 Figure 7.22: Filter by Device Type.
Filter by Device Type to see callers who accessed your website using their desktop or mobile device (Figure 7.22 above).
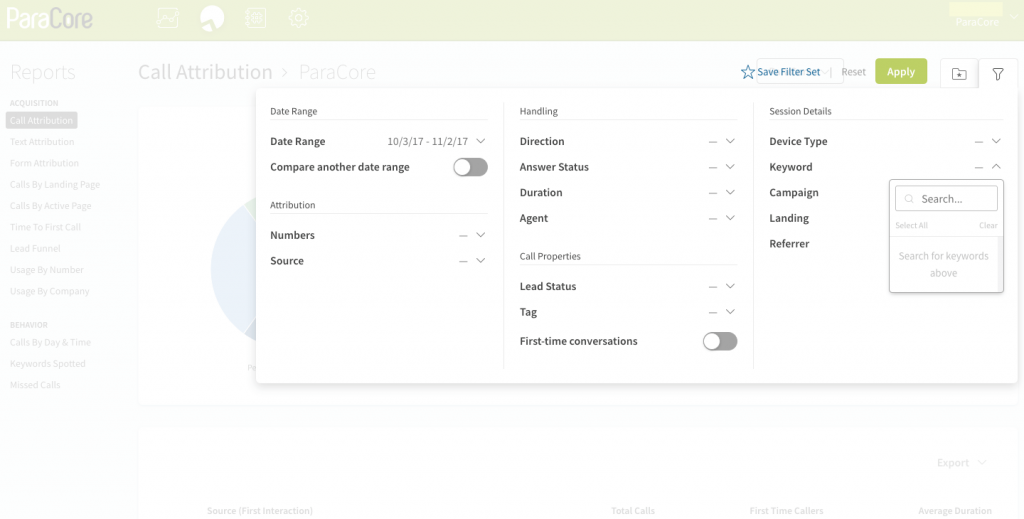 Figure 7.23: Filter by Keyword.
Filter by Keyword to search for the keywords you’re bidding on that brought calls into your business (Figure 7.23 above).
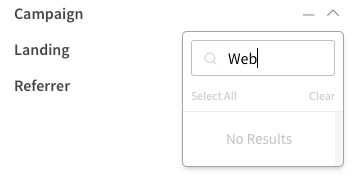 Figure 7.24: Filter by Campaign.
Filter by Campaign to search for a specific campaign that brought calls into your business (Figure 7.24 above). Filter by Landing to search for a specific landing page on your site, and to find the calls that came from that page (Figure 7.25 below).
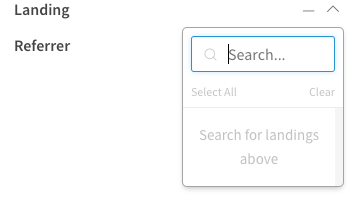 (Figure 7.25: Filter by Landing.)
Filter by Referrer to search for a specific third-party search engine or website that brought calls into your business (Figure 7.26 below).
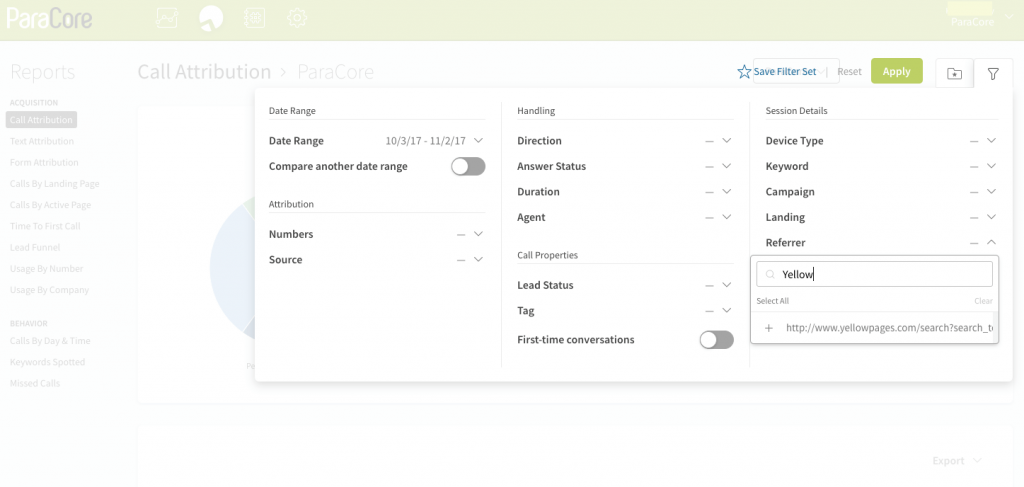 Figure 7.26: Filter by Referrer.
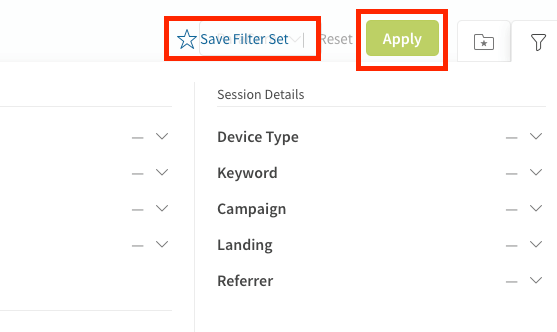 Figure 7.27: Save your filter settings and/or click the green “Apply” button.
After you’ve made all of your filter selections accordingly, click the green Apply button at the top of the page to update your report with the selected filters (Figure 7.27 above). You can also save this filter set for future use by clicking Save Filter Set, or click Reset to start fresh with no filters. To save your report as a CSV file or print it out, follow the same steps you did for the tagging report. Just click on the Export button and choose one of those two options. From here the other three reports generate the same way, but for different uses. The report you might want to look at is Form Attribution to see how your website forms are performing and how much traffic they receive. The Form Attribution report provides insight into the sources that are generating form submissions on your website. As you saw with the Call Attribution report, you’ll access the Form Attribution report from the same sidebar menu after you select the company (Figure 7.28 below).
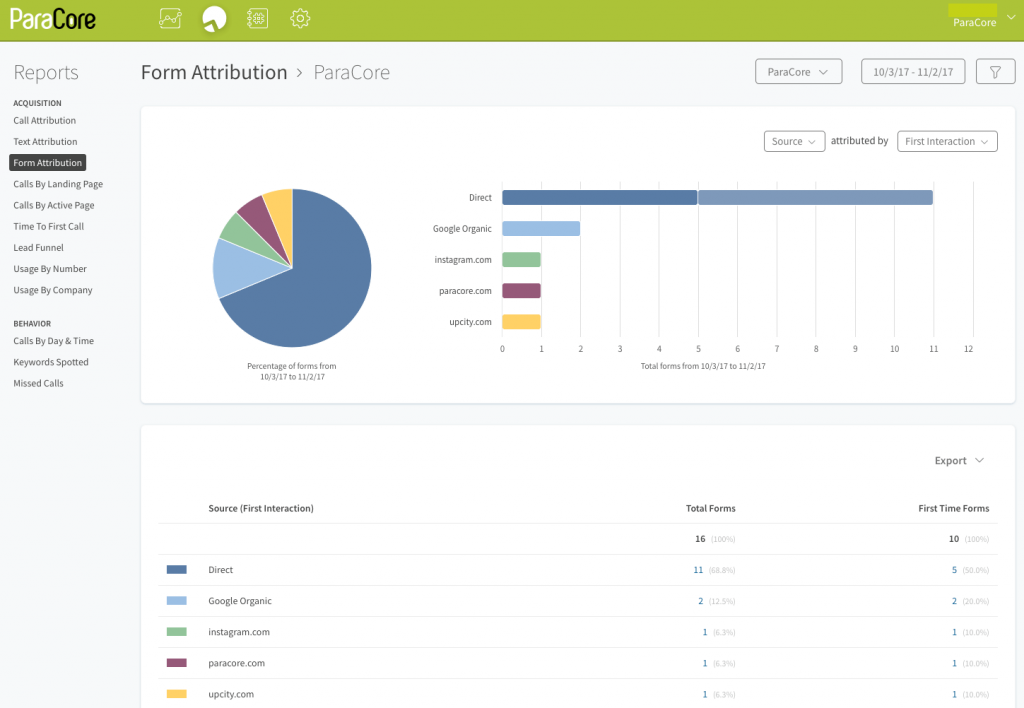
Figure 7.28: This is an example of the Form Attribution report.
Follow the same directions for choosing the filters you want generated in your report. Keep in mind that instead of calls filters, they’ll be form submission filters. Once you’ve applied your filters you can export to a CSV file or print the generated report. Another report is the Calls by Landing Page report.
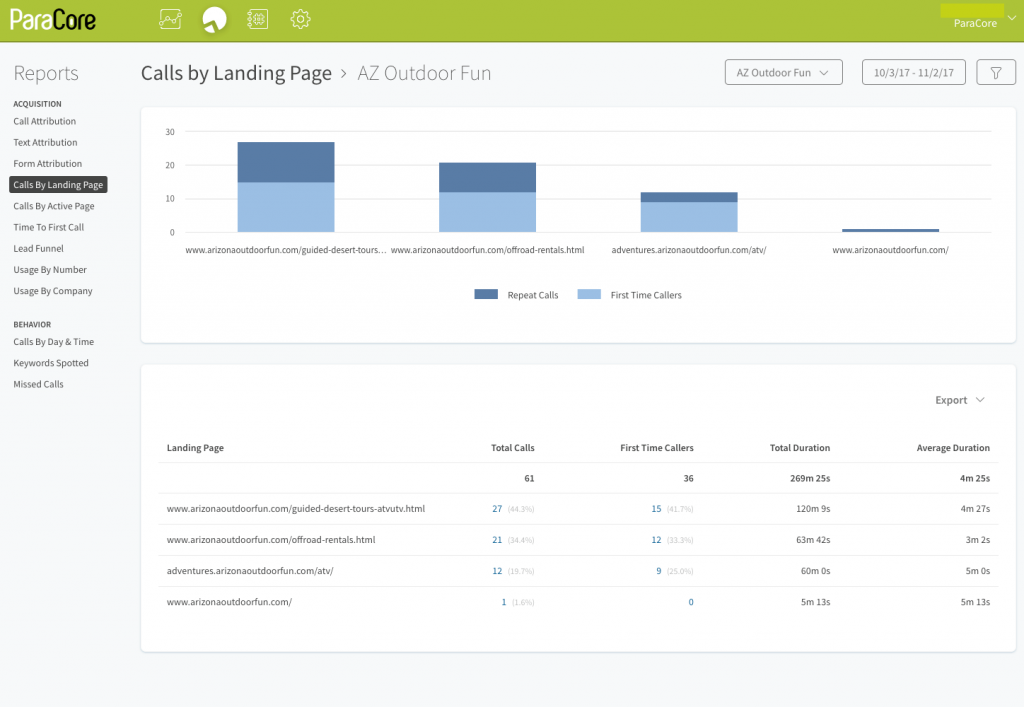 Figure 7.29: This is an example of the Calls by Landing Page report.
The Calls by Landing Page report details the pages on your website that callers landed on first when they came to your site (Figure 7.29 above). You can use this report to learn more about how callers interact with your website and determine which pages provide the most conversions.
For example, if a caller visits your website and lands on the page az outdoor fun dot com, then visits several other pages on your website, az outdoor fun dot com will represent this caller’s data in the Calls by Landing Page report. In order to capture a visitor’s session and correlate it with a landing page, this report requires keyword-level tracking with the dynamic number insertion script installed on your website. We covered dynamic number insertion including scripts in Video Three. If you want to run this report, make sure you have them installed before you continue. Once you’ve applied your filters and generated your report, you can export it to a CSV file or print it. Now let’s talk about the final report in our video, which is the Lead Funnel report.
 Figure 7.30: This is an example of a Lead Funnel report.
The Lead Funnel report provides a breakdown of how many of your callers become leads (Figure 7.30 above). Using this information, you can see which of your marketing sources are driving the most calls to your business, and how many of those calls translate to leads. Callers are visitors to your website that dialed one of your keyword tracking numbers. Leads are callers that have been classified as a lead using CallScore or Manual Lead Classification, which we covered in Video Six if you need a recap. The columns below the pie chart illustrate which sources and campaigns bring callers into your business, as well how many of these callers became leads. So, the look of this report’s page is slightly different. However, the filter choices are exactly the same as the other reports we’ve covered in this video. After you apply your filters and generate your report, you can export it to a CSV file or print it.
So, there you have it, that’s your overview of generating CallRail Reports for your PPC campaigns. Make sure you check out our next video about CallRail Call Flow where we’ll cover how to set them up when you’re not available, but don’t want your customers to feel like correctly, and utilize them wisely.
If you enjoyed this video, please click the like button and make sure you click that red subscribe button below this video to receive updates on this series and more. Also, we’d like to hear from you. If you have questions or comments please post them below and I’ll see you in the next video!
Related Posts
- CallRail: Text Messaging
- CallRail: Integrations Overview
- CallRail: How to Block Spam Calls
- CallRail: Call Tagging
- CallRail: Notifications Overview
- CallRail: Activity Dashboard Overview
- CallRail: Interface Overview
- CallRail: Call Flow Tutorial
- CallRail: Form-to-Call Lead Handling
- CallRail: Multi-touch CPL Feature
- CallRail Keyword Spotting & Auto-tagging
- Call Tracking Overview
- CallRail Local Number Swap
- CallRail Bonus Features
- Using CallRail for Customer Service
- Call Flow Options
- Call Tagging, Scoring & Lead Classification
- CallRail Notifications
- How to Setup CallRail Integrations for Your PPC Campaign
- Creating & Using Phone Numbers in CallRail
- Call Tracking Explained
Want In-Depth PPC Training?
Visit the ParaCore AcademyPrevious Video
Previous BlogCall Tagging, Scoring & Lead ClassificationNext Video
Call Flow OptionsNext BlogCurious how we can improve your campaigns?
Schedule some time to chat with our team so we can learn more about you and your business.
