Have you ever looked at your website and thought, “I wonder how many people submitted the contact form?” Or maybe you’ve needed to know how many people downloaded a particular document.
Google Analytics (GA) is a great platform for reviewing common metrics. However, if your site is built to encourage visitors to take action (it should be) then you might be left wondering how to track those actions.
Events are a powerful, simple method of tracking actions on a website.
What are Google Analytics Events?
When a visitor on your website does something they are performing an action. They might be clicking a button, downloading a PDF, viewing a video or opening a hidden section of your site. GA Events track these actions, record the data in Google Analytics and allow you to review and report on them later.
For example, you might have a white paper PDF you want people to download on your home page. With the standard implementation of Google Analytics, it can be difficult to track how many people download the PDF. It’s even more difficult and time consuming to create a report that shows the number of downloads over time.
By attaching a GA Event to a visitor downloading the document, you can track the activity in GA, report on it easily, add it to your analytics dashboard and even segment by geographic location, traffic source, etc.
Creating Events
Adding events to your website requires three simple steps.
- Identify the actions you to want to track
- Outline the category, action, label and value (more on this later)
- Add the event tracking to your site
1. Identify the action you want to track
Do you want to track how many times your contact form has been submitted? Maybe you want to track how many people have signed in to your members area. Virtually any action can be tracked as an event so let your imagination run wild!
2. Outline the category, action, label and value
Events consist of four parts. These pieces are somewhat arbitrary and can be anything, but it’s a good idea to spend time organizing them up front for easier reporting later.
- Category – The high level categorization of the events. Oftentimes these group the events into site features like “Membership Area” or “Interactive Map”.
- Action – The action that was taken that you want to track
- Label – The most detailed part of the information being tracked (optional)
- Value – An arbitrary value for this action (optional)
Lets work with an example. Imagine you own 5 clothing stores and want to track visitor behavior on an interactive map you’ve created. You want to track the following actions:
- Which zip codes people are searching most often
- How many times a location is clicked to view more information
- How often a visitor clicks the phone number to call the location on a mobile device
- How often visitors open the advanced search
The first step is to categorize the metrics. In this case, I might categorize 1 and 4 into “Map Usage” and 2 and 3 into “Location Metrics”. I’d then choose a name for the Action piece that describes the action the user has taken. Finally, we can add an optional label for more detail. The label can consist of the actual data that was entered like the zipcode. It can also include more detail regarding the action like the advanced search being “opened”.
[table id=1 /]
3. Add the event tracking to your site
Now that the hard part is done, we simply add the tracking code to your website.
If you want to nerd out for a minute, here are the four metrics we just outlined in code format. These are added to your Javascript and need to be called manually when the event occurs on your site. The last piece, with a “[” and “]” means that section is variable and will be replaced with the dynamic value the user generated.
Viewing events in Google Analytics
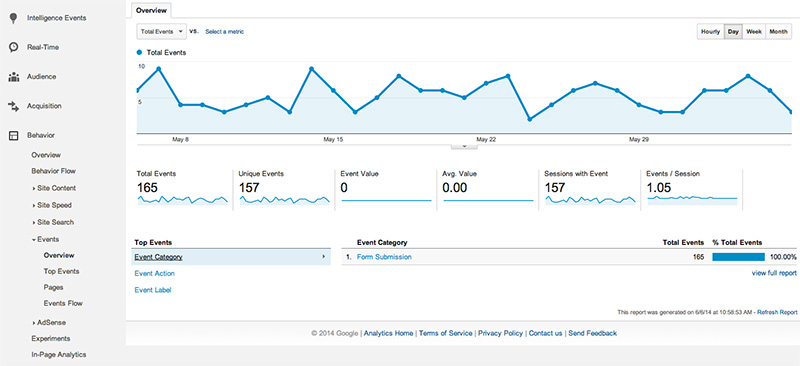
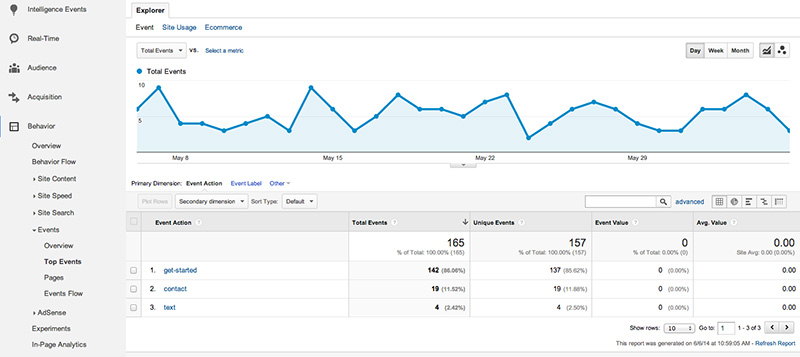
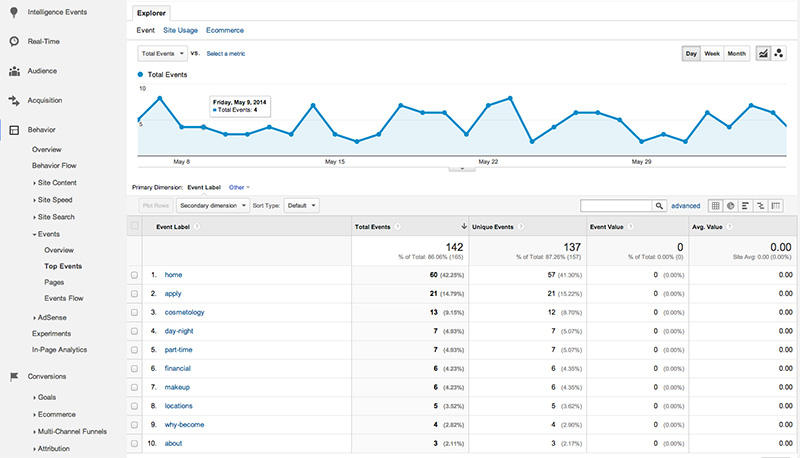
Once you’ve identified your events, organized them for the developers and then had them added to your site, it’s easy to view the results in the analytics dashboard. The events area is in the left column under the Behavior headline.
The next three screenshots show how to view each piece of the event data as you drill down from Category to Action to Label.
Event Categories
Event Actions
Event Labels
As you can see, these metrics are shown in analytics just like any other. You can further segment your reports by filtering the secondary dimension to determine the source of visitors, campaign, etc.
Events in a nutshell
Adding custom tracking to your website is a powerful way to automate information and reporting. If you’re keeping an external spreadsheet to count how many form submissions occur on your site, do yourself a favor and organize a few events to automate the process. Once they’re in place you have a tremendous amount of information at your fingertips.
If you’d like to review the technical details of Analytics Events, the following links to the their online docs.
Google Analytics Event Reference
Related Posts
- What Is The Difference Between PPC and SEM?
- PC Audit Handbook: How to Analyze Your PPC Campaigns
- The Best PPC Tools of 2022, As Told by PPC Experts
- Beginner’s Guide to UTM Tags & Tracking
- Generate Leads with Facebook Lead Ads
- Cost-per-click vs. cost-per-acquisition: Are you tracking the right PPC metrics?
- How Does Pay Per Click Work?
- Benefits of PPC
- Why Should I Invest in PPC?
- What is Google PPC Advertising?
- Facebook Retargeting Strategy
- Introduction to ManyChat
- Case Study: Return on Ad Spend Optimization
- 🎁🎄 Holiday Ad Spend Strategy
- Should You Be Running Branded Ads?
- SEO vs SEM
- CTAs for YouTube Ads
- Case Study: 258% Increase in Conversions
- Traffic Campaign Strategy
- No Captions on Facebook Ads or YouTube? You’re Killing Performance
- LinkedIn InMail Website Re-targeting
Previous Blog
Previous BlogHow to Build a Successful Web ProjectLeave a Reply
You must be logged in to post a comment.


