Want In-Depth PPC Training?
Visit the ParaCore Academy
Working with a new client with zero history of Facebook advertising?
Estimating budgets and results can be tricky when there’s no historical data to draw on. So how do you get started?
First, let’s touch on building an audience.
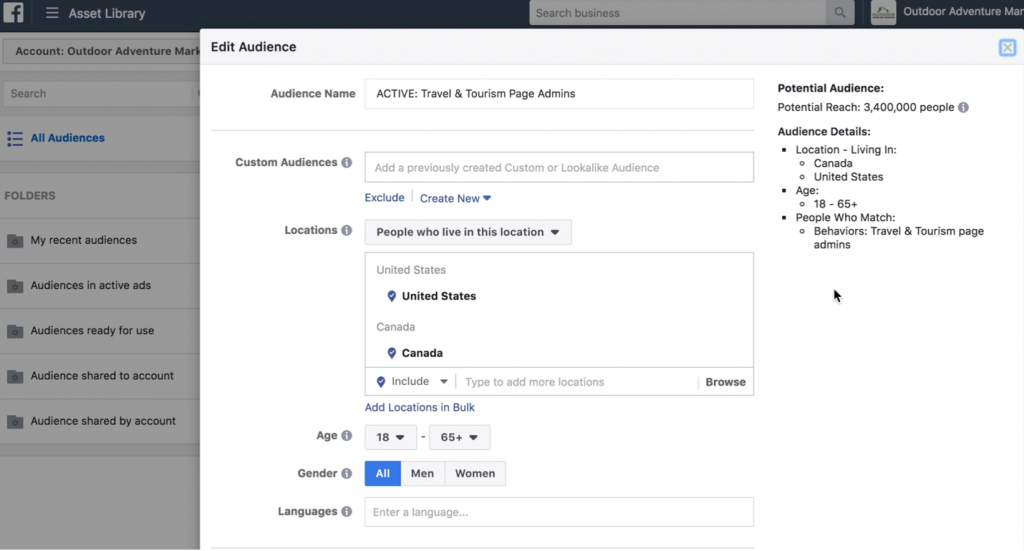
Here is the Audience Builder in Facebook and an audience that we’ve used previously at ParaCore for outdoor/adventure marketing.
A question we often get: What’s a good audience size?
If a client we work with is in a very specific geographic market, the audience might be 10,000 people. Or it might be 30 or 40!
ParaCore tip: We work to bring our audiences down closer to 800,000 to a million, plus or minus. It’s not an exact science, of course. It all depends on the budget, but a good ballpark figure to keep in mind!
Back to this 3.4-million-person audience (yes, high for us!). It’s been built out and saved to use in Ads Manager. where we can put in a budget.
Second common question we get: what should my budget be?
I like to ask: How many leads do you want to buy, and how much business can you handle?
But, just to show how our estimations work, I’ll do a budget of $100 per day in Ads Manager, selecting the audience that I just built.
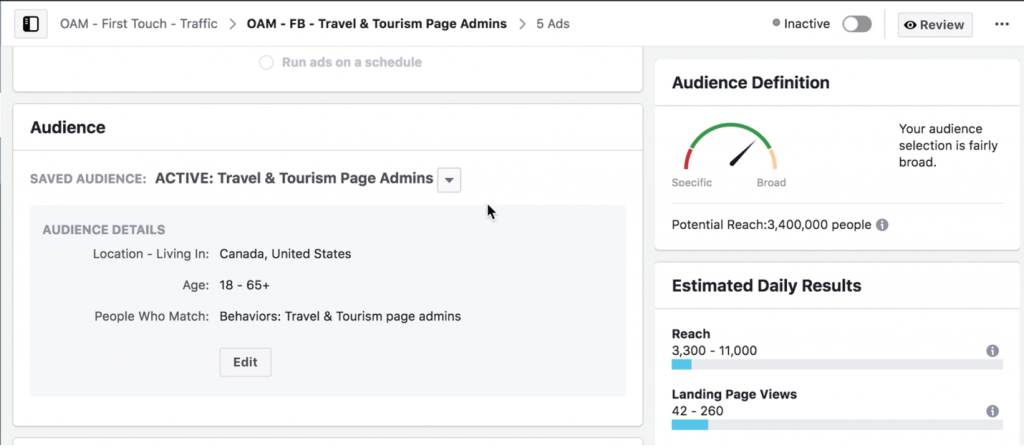
Now, in addition to the audience, you’ve got estimated daily results for reach and landing page views.
In this case, the reach is 3,300 to 11,000 people, and 42 to 260 landing page views.
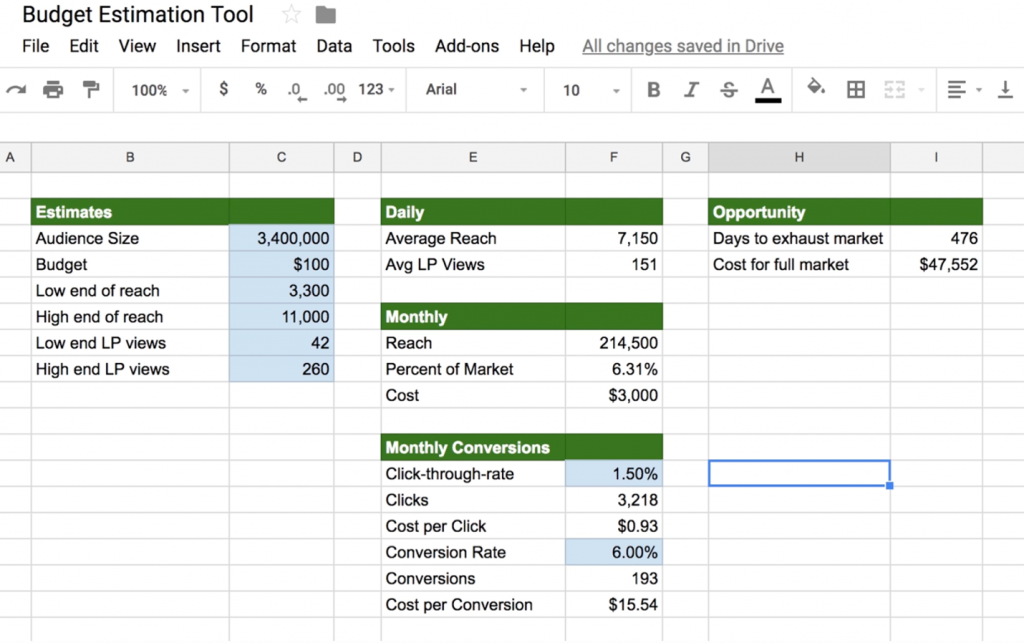
Now, let me show you a calculator that we’ve built at ParaCore that allows you to estimate several more metrics, like monthly reach, the percentage of market reached, and the cost of monthly conversions.
Now, let’s go back to Ads Manager and the right-hand side with Daily Results.
My average daily reach is the two numbers divided by two: in this case, 7,150.
The monthly reach is the resulting number multiplied by 30: 214,500
The percentage of market is how much of our market will be reached in each month: I take the reach and I divide it by the audience size.
So, if our audience size shifts to 3.3 million, as it did in the example below, and our reach is 217,000, the percentage of market is 6.59%.
Paracore Tip: Percentage of market is a number to know because if you’re reaching 90% of your market in one month, frequency will be a lot higher. On the flip side, if you’re at a very low percentage, that gives you quite a bit of opportunity in the future!
Next, let’s start to back into some conversions and get a feel for what the performance is going to look like.
Here, under the Monthly Conversions column, I changed the click-through rate to 1.25% and the conversion rate to 8%.
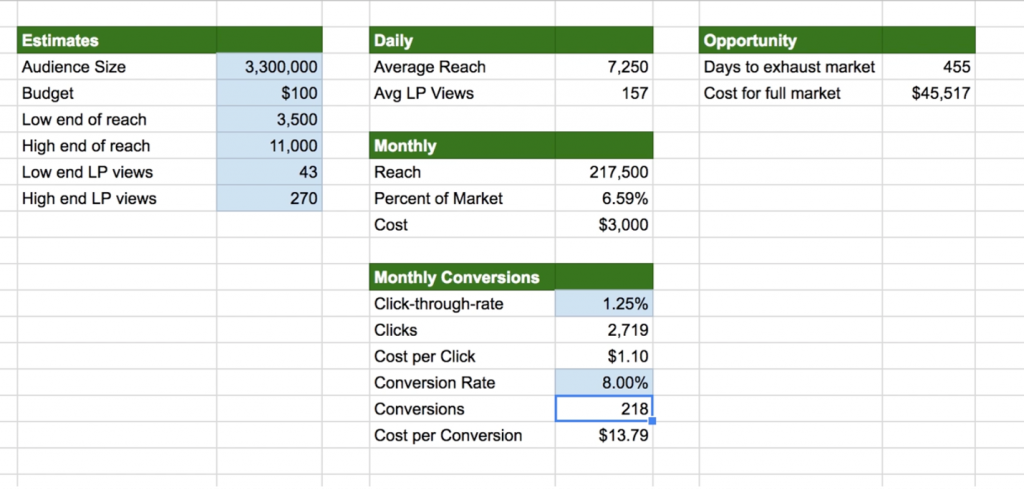
Over the course of a month, that means that we’re looking at 2,719 clicks; here, I’m automatically calculating the cost per click, which is essentially the number of clicks over the budget.
What about choosing the right conversation rate?
Here in this example, we’re using 8%, based on data we already had on the client.
So, 2,719 clicks multiplied by 8% equals 218 conversions. Your cost per conversion in this case would be $14.
That’s a good number that you can start talking to your customers about!
That said, one thing to keep in mind, especially when you’re running Facebook, is that your conversion rate might not be that high. We have campaigns that run at 1% and 2% conversion rates because the users have no intent to purchase on Facebook; it’s more like a billboard, putting it in front of them.
On the higher end, we get as high as 25% when it’s a high-intent campaign where someone’s in Google and they know what they’re looking for. The range can be quite dramatic!
ParaCore Tip: Be very, very, very conservative on these numbers, especially if you don’t have historical data to work through!
So assuming we have no data, let’s adjust the click rate at 1%, and the conversion rate at 1.5%.
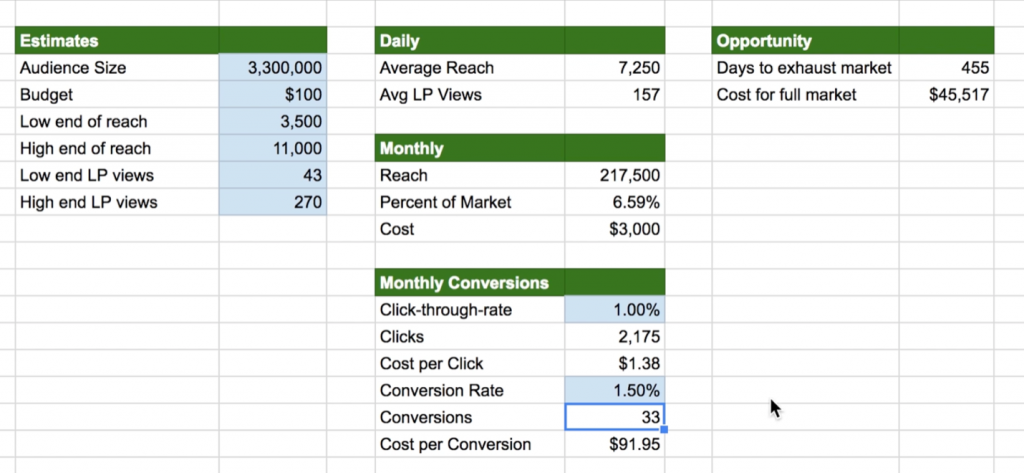
With that adjustment, you can see that conversions go down, and costs go up. But, depending on your industry, under $100 per conversion might be a good thing!
Also, take a look at the Opportunity column: Days to exhaust market: 455. Cost for full market: $45,000.
So, if this client wanted to go through their entire market in one month, their ad budget might be $45,000 per month.
The following month, using an audience of the exact same size and another $45,000, it would buy them their second impression, theoretically.
That’s how we calculate opportunity cost in Facebook in the audience size.
So, in summary:
- Build the audience first
- Play with Ad Set Manager placements and budgets to get the potential reach and page views
- Plug them into a tool to create projections
In need of more guidance through the process? Scroll up to watch the video or reach out directly with questions!
Related Posts
- The Ultimate Guide on Creating a Facebook Ads Strategy in 2023
- Facebook Ads Best Practices In 2023
- How To Create an Effective Landing Page for Facebook Ads
- How To Optimize Facebook Ads for The Highest ROI
- Facebook Ads for Small Businesses: The Most Bang For Your Buck
- Facebook Ads vs Boosted Posts: Which Is Better For You?
- The Facebook-Ad Checklist to Review Before Launching Any Campaign
- Are Facebook Ads Worth it? Pros and Cons of Facebook Ads
- What is a Good ROAS for Facebook Ads?
- How to Write FaceBook Ad Copy That Sells
- Facebook Business Manager Overview
- Increase ROAS with Facebook Lookalike Audiences
- Why You Should Use Campaign Budget Optimization
- Is the Conversion or Traffic Objective Right for Your Campaign?
- Build Lookalike Audiences Using Lead Ads
- Connecting Your Lead Form to Your CRM
- How to Find Lead Forms in Facebook
- Facebook Retargeting Strategy
- Overview of Facebook Objectives & Ad Formats
- Facebook Ad Frequency 101
- How to Organize Your Facebook Ads Campaign

